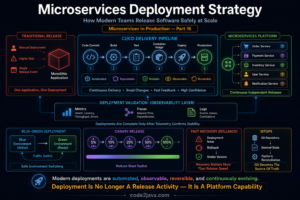
Observability in Microservices — Why Distributed Systems Become Invisible Without It
One of the most interesting things that happens during a microservices transformation is that engineering teams often become more successful at building systems while simultaneously becoming less capable of understanding them.
At first, this sounds contradictory. Organizations invest in microservices to improve scalability, accelerate deployments, increase team autonomy, and reduce coupling between applications. Most of these goals are achieved successfully. Services become independently deployable, teams move faster, and infrastructure scales more efficiently.
However, a new problem quietly emerges, the architecture becomes harder to see.
In a monolithic application, understanding system behavior is relatively straightforward because most business operations execute inside a single runtime. Developers can follow requests through application logs, inspect thread dumps, analyze database interactions, and usually identify problems without leaving the boundaries of a single application.
Distributed systems behave differently. A single customer request may now travel through multiple APIs, message brokers, databases, caches, third-party integrations, and asynchronous workflows before completing successfully. The business transaction remains the same, but the execution path becomes significantly more complex.
As a result, one of the biggest challenges in modern software architecture is no longer building distributed systems. it is understanding what those systems are actually doing while they run.
This is where observability becomes critical.
1. Why Distributed Systems Become Operationally Invisible
One of the hidden costs of microservices is the loss of natural visibility. When applications run as a monolith, most of the information engineers need exists in one place. The application generates logs, exposes metrics, connects to a database, and executes business logic within a single runtime boundary. If performance degrades or errors increase, engineers can usually investigate a relatively small set of components.
As organizations move toward distributed architectures, that simplicity disappears. Business workflows no longer execute inside a single process. Instead, they span multiple independent services, each with its own deployment lifecycle, runtime environment, infrastructure dependencies, and operational characteristics.
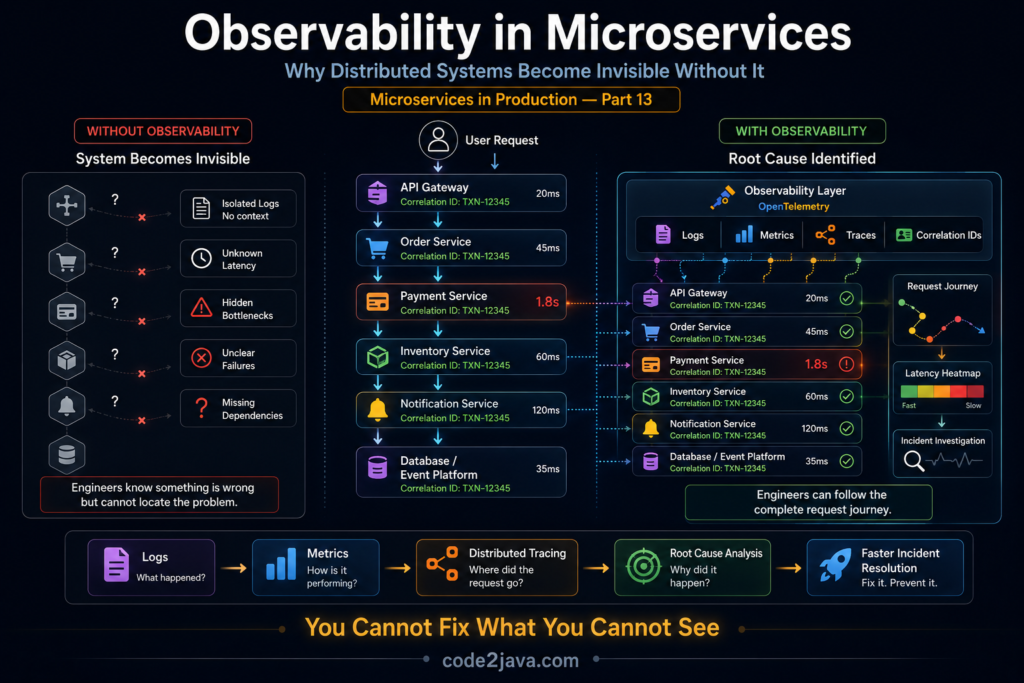
Consider a simple customer checkout operation. From a user’s perspective, clicking the “Place Order” button appears to trigger a single action. Internally, however, the request may travel through an API Gateway, authentication service, order service, payment processor, inventory system, notification service, and analytics pipeline before the transaction completes.
- Every service generates its own logs
- Every service publishes its own metrics
- Every service can experience latency independently
- Every service can fail independently
The challenge is not that information disappears, the challenge is that information becomes fragmented across dozens of systems. Engineers no longer investigate an application, they investigate interactions between applications.
This fragmentation is what makes distributed systems operationally invisible without proper observability practices.
2. Why Monitoring Alone Stops Working
When organizations first begin operating distributed platforms, monitoring usually becomes their primary operational capability. Teams create dashboards that track infrastructure health, application performance, and system utilisation. They configure alerts for CPU usage, memory consumption, response times, error rates, and service availability. These indicators provide valuable insight into whether the platform is functioning correctly.
For a period of time, this approach works well. Monitoring excels at detecting known problems. If CPU usage exceeds a predefined threshold or if error rates increase unexpectedly, the monitoring system generates alerts and engineers can investigate further.
As the architecture grows, however, incidents become more complicated.
Imagine an alert indicating that checkout latency has increased significantly. The monitoring dashboard confirms the issue. Response times have doubled, customer transactions are slowing down, and service-level objectives are at risk.
The problem is that the dashboard does not explain why,
- Did a database query become inefficient?
- Did a downstream API start responding slowly?
- Did a recent deployment introduce contention?
- Did retries amplify traffic somewhere else in the system?
- Did an event consumer fall behind and create processing delays?
Monitoring successfully detected the symptom, but It could not explain the cause. This is where many engineering teams discover that visibility and understanding are not the same thing.
Knowing that something is broken is useful, understanding why it broke is far more valuable.
3. The Real Difference Between Monitoring and Observability
Many technical discussions present monitoring and observability as competing concepts. In reality, they complement each other.
Monitoring focuses on predefined questions. Engineers decide in advance which metrics matter, which thresholds indicate risk, and which conditions should trigger alerts. The monitoring platform continuously evaluates those conditions and notifies teams when abnormalities occur.
This approach works extremely well for known failure scenarios.
The challenge is that distributed systems continuously generate unknown failure scenarios. Modern architectures contain thousands of possible interactions between services, databases, infrastructure components, message brokers, and external dependencies. Predicting every potential failure mode in advance is practically impossible.
Observability addresses this challenge differently. Instead of relying solely on predefined conditions, observability provides enough runtime information for engineers to investigate unexpected behaviour after it occurs.
This distinction becomes important during production incidents.
Monitoring might reveal that latency increased at 10:03 AM. Observability helps explain which service introduced the latency, which dependency triggered the slowdown, how requests propagated through the platform, and why customers experienced degraded performance.
In simple terms: Monitoring tells you that something happened, Observability helps you understand what happened.
As systems become more distributed, understanding becomes significantly more important than detection alone.
4. Logs — The First Layer of Visibility
Most observability journeys begin with logs.
Logs provide a detailed record of application activity by capturing runtime events as they occur. Every request, exception, business transaction, authentication attempt, and infrastructure interaction can potentially generate log entries.
When engineers investigate incidents, logs often provide the first clues. For example
- A payment service might log a timeout while calling an external provider
- An authentication service might record token validation failures
- A database layer might capture query execution errors.
These details help engineers understand what happened inside a specific component, this is why logs remain one of the most valuable operational assets in software engineering. They provide context, they explain behaviour, they reveal details that metrics alone cannot capture.
As systems grow, however, logs introduce their own challenges. A small application may generate thousands of log entries per day, a mature microservices platform may generate millions every hour.
The problem shifts from collecting logs to finding meaningful information within them.
At that point, observability requires more than simply storing log data. It requires the ability to correlate, search, and connect log information across an entire distributed ecosystem.
5. Why Logs Alone Fail at Scale
Many organizations initially believe that centralized logging solves observability. After all, if every service sends logs to a shared platform, engineers should theoretically be able to investigate any incident. In practice, reality becomes more complicated.
Imagine a production issue affecting a customer transaction that traverses ten services. Each service may generate dozens of log entries while processing the request. Some logs contain business events, others contain infrastructure information, and many are completely unrelated to the incident.
Now multiply that across hundreds of services and thousands of requests per second. The volume becomes overwhelming. More importantly, logs rarely provide complete visibility into system behaviour.
Logs explain what happened inside a service, but they do not naturally explain how requests moved between services. They reveal individual events, but they struggle to reconstruct end-to-end execution paths across distributed systems.
This limitation becomes especially visible during latency investigations. An engineer may discover that a request spent five seconds somewhere in the system. Logs can reveal what individual services did. They cannot easily reveal where the five seconds were spent across the entire request journey.
As distributed architectures grow, organizations eventually realize that logs are necessary but insufficient. They provide one piece of the observability puzzle.
Understanding the full picture requires additional signals.
6. Metrics — Understanding How the System Behaves
As microservices platforms grow, engineers quickly discover that logs are excellent for explaining individual events but far less effective for understanding overall system behaviour. During a production incident, teams often need answers to questions that logs alone cannot provide.
- Is latency increasing gradually or did it spike suddenly?
- Are all services affected or only a specific subset?
- Is traffic growing faster than the system can process it?
- Are queues building up somewhere in the architecture?
These questions require a different type of visibility, this is where metrics become essential.
Metrics transform runtime behavior into measurable signals that engineers can track continuously over time. Instead of describing individual events, metrics reveal patterns. They help teams understand whether the platform is healthy, degrading, recovering, or operating near its limits.
For example, a sudden increase in CPU utilization may indicate that a service is struggling under load. A growing request queue may suggest that consumers cannot keep pace with incoming traffic. Rising response times may reveal contention somewhere in the request path long before customers begin reporting issues.
One of the most valuable aspects of metrics is their ability to expose trends that humans would never detect through logs alone. A single slow request may not seem concerning. A gradual increase in average latency across thousands of requests often signals a much larger problem developing beneath the surface.
This is why modern platforms monitor metrics such as:
- Request throughput
- Response latency
- Error rates
- CPU utilization
- Memory consumption
- Thread pool usage
- Database connection pool utilization
- Queue depth
- Consumer lag
Collectively, these measurements provide a health dashboard for the platform.
However, metrics have an important limitation.They are extremely effective at showing symptoms, but they rarely explain root causes.
A dashboard may clearly indicate that response times increased by 300 percent. The dashboard cannot automatically explain whether the increase originated from a slow database query, a network bottleneck, an overloaded thread pool, or a downstream dependency failure.
To answer those questions, engineers need another layer of visibility.
7. Distributed Tracing — Reconstructing the Request Journey
If logs explain what happened inside a service and metrics reveal how the platform behaves over time, distributed tracing explains how a request moved through the system — This capability changed how organizations operate microservices.
To understand why, consider a common production scenario.
A customer attempts to place an order and experiences a ten-second delay. The API Gateway appears healthy. CPU utilization across services looks normal. Error rates remain low. Nothing immediately explains the slowdown.
Without tracing, engineers often begin investigating service by service. They examine logs, compare timestamps, inspect infrastructure dashboards, and attempt to reconstruct the request path manually. This process is slow and often frustrating because distributed systems do not naturally expose end-to-end execution flow.
Distributed tracing solves this problem by treating the request itself as the primary unit of investigation. When a request enters the platform, the tracing system assigns a unique trace identifier. As the request travels through services, databases, message brokers, and external dependencies, each component records timing information and execution details associated with that identifier.
The observability platform then reconstructs the complete journey. Instead of viewing isolated services, engineers can see the entire transaction as a single execution flow. A trace may reveal that:
- Authentication completed in 20 milliseconds.
- Order validation completed in 50 milliseconds.
- Inventory lookup completed in 30 milliseconds.
- Payment processing consumed 8 seconds.
Immediately, the bottleneck becomes obvious. Rather than searching through thousands of logs, engineers can focus directly on the component responsible for the delay.
This ability dramatically reduces incident investigation time and has become one of the defining capabilities of modern observability platforms.
8. Correlation IDs — The Glue Holding Observability Together
Distributed tracing depends on a concept that rarely receives much attention but plays a critical role in observability. That concept is the correlation identifier.
At first glance, a correlation ID appears simple. It is merely a unique value assigned to a request. The real power emerges when that identifier travels consistently through the entire distributed system.
Imagine a customer request flowing through six services
- each service generates logs
- each service produces metrics
- each service may create tracing spans.
Without a shared identifier, these signals remain disconnected. Engineers must manually compare timestamps, request payloads, and service activity to determine which events belong together. As the platform grows, this becomes nearly impossible.
Correlation IDs solve the problem by creating a common thread that connects every runtime signal generated during a transaction. When engineers investigate an incident, they can search using the correlation ID and immediately retrieve related logs, traces, events, and service interactions.
In many organizations, correlation IDs become one of the most important operational standards because they transform fragmented telemetry into a connected story. Without them, observability tools lose much of their effectiveness.
9. OpenTelemetry and the Rise of Unified Observability
As observability matured, organizations faced a new challenge. Every team seemed to use different tools, different instrumentation approaches, and different telemetry formats.
One service generated metrics differently than another. Tracing libraries varied between frameworks. Logging implementations differed across teams. Integrating observability data became increasingly difficult as platforms expanded.
This fragmentation created operational complexity of its own. Engineers often spent as much time integrating telemetry systems as they did analyzing telemetry itself. OpenTelemetry emerged as a response to this problem.
Rather than acting as a monitoring platform, OpenTelemetry provides a standardized framework for generating and collecting observability data. Applications instrument their code once and then export logs, metrics, and traces to whichever observability platform the organization prefers.
This standardization significantly simplifies platform engineering efforts. More importantly, it creates consistency.
When every service generates telemetry using the same approach, engineers can analyze system behavior more effectively because the data follows common conventions across the architecture.
Today, OpenTelemetry has become one of the most important building blocks in cloud-native environments because it allows organizations to create observability strategies that remain consistent even as technologies, frameworks, and platforms evolve.
10. What Real Production Investigations Actually Look Like
The true value of observability becomes clear during production incidents.
Consider a situation where customers begin reporting slow checkout operations.
- The application remains available
- Infrastructure appears healthy
- No obvious service failures exist
From a business perspective, however, the platform is clearly struggling.
Without observability, engineers often begin a process of elimination. Teams inspect logs, compare deployments, restart services, review infrastructure metrics, and search for anomalies. This approach frequently leads to long investigation cycles because every component becomes a potential suspect.
Observability changes the workflow entirely —
- Metrics may reveal that checkout latency increased sharply during the last thirty minutes
- Distributed traces may show that requests spend most of their time inside the payment workflow
- Further analysis may reveal a database query executing far slower than normal
- Database metrics may then identify connection pool exhaustion caused by an unexpected traffic spike.
What initially appeared to be a platform-wide issue ultimately originated from a single bottleneck. The difference is not that observability prevented the incident, but it helped engineers locate the problem quickly and confidently.
As systems become larger, this capability becomes one of the most important operational advantages an engineering organization can possess.
Summary
Microservices provide flexibility, scalability, and independent deployment capabilities, but they also make systems significantly harder to understand. As business transactions begin crossing multiple services, databases, networks, and asynchronous workflows, traditional troubleshooting approaches become increasingly ineffective.
Observability solves this challenge by transforming runtime behavior into actionable insight.
Logs provide detailed context about individual events. Metrics reveal trends and system health. Distributed traces reconstruct complete request journeys across the platform. Correlation IDs connect these signals into a coherent story, while OpenTelemetry standardizes how organizations collect and analyze telemetry at scale.
The most important lesson is that observability is not a collection of tools, it is the mechanism that allows engineers to understand how distributed systems behave under real production conditions.
As architectures continue becoming more distributed, observability evolves from an operational enhancement into a foundational architectural capability. Mature engineering organizations recognize this reality early and invest in visibility long before their next production incident forces them to.