
Performance & Scalability — What Actually Happens at Runtime
1. Why Performance Feels Different in Microservices
By the time a system moves to microservices, there is usually an expectation that performance will improve naturally. The logic behind this assumption is straightforward, smaller services should execute faster, scaling should be more flexible, and load should distribute more evenly.
In practice, performance does not improve automatically. It changes in nature. What was once a single, predictable execution path inside one system becomes a sequence of interactions across multiple services. The system no longer behaves like a single application. It behaves like a network of independent components.
This shift changes how performance must be understood. Instead of optimizing one system, you now have to understand how multiple systems interact under load.
2. The Shift from CPU Time to Network Time
In a monolith, most of the time spent processing a request is consumed by computation and database operations. Everything happens within the same memory space, and communication between components is immediate.
In microservices, communication moves to the network, every interaction between services requires data to be serialized, transmitted, and reconstructed. This introduces additional overhead that did not exist before.
More importantly, network behaviour is not stable. Latency varies based on load, congestion, retries, and failures. As a result, execution time becomes less predictable. What used to be a relatively stable operation now carries variability at every step.
3. Latency Accumulates Across Service Boundaries
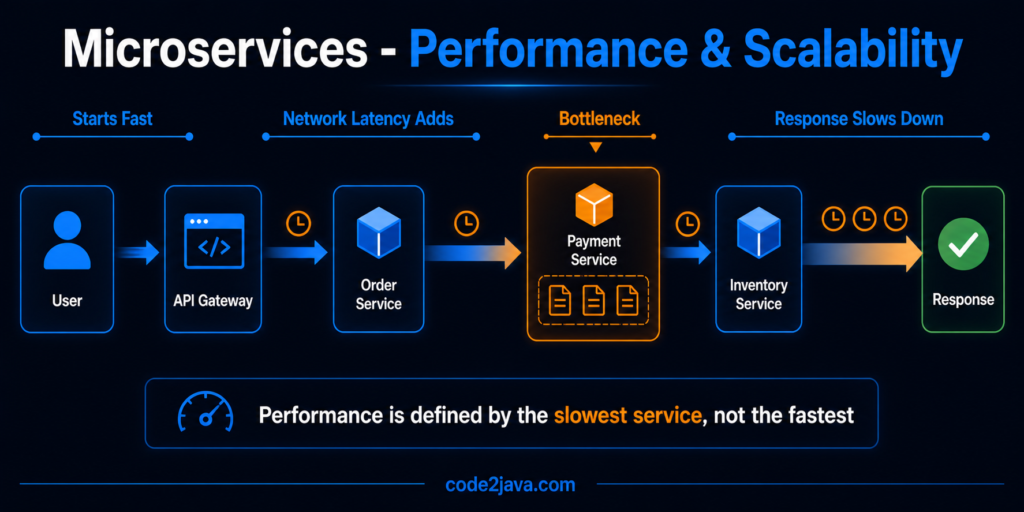
In distributed systems, latency is not isolated to a single operation. A request often passes through multiple services before completing. Each service adds its own processing time and network delay.
Even if each service performs efficiently on its own, the total latency increases as these delays accumulate. More importantly, variability compounds. A small delay in one service affects all downstream services.
This creates a system where performance is not defined by the speed of individual components, but by the combined effect of all interactions. The slowest part of the chain determines the overall response time.
4. Thread Blocking Becomes the Limiting Factor
Most microservices systems continue to use a synchronous execution model where each request is handled by a dedicated thread. When a service calls another service, the thread waits for a response before continuing.
Under light load, this model works well. Under heavy load, it becomes a bottleneck. As downstream services slow down, threads spend more time waiting. This increases the number of threads that are idle but still consuming resources.
As more requests arrive, thread pools begin to fill up. Once the pool reaches its limit, new requests are delayed before they can even begin processing. At this stage, the system is no longer limited by CPU capacity but by its ability to manage waiting threads.
This is why systems can appear overloaded even when CPU utilization is not at its maximum.
5. JVM Behavior Becomes Distributed
In a monolith, performance tuning focuses on a single JVM. Memory usage, garbage collection, and thread management are centralized.
In microservices, each service runs in its own JVM. This means that performance characteristics are no longer consistent across the system. One service may be running efficiently, while another experiences memory pressure or GC pauses.
This distributed runtime behaviour introduces variability. Performance issues are no longer global—they are localized to individual services, but their effects are visible across the system.
6. Garbage Collection Introduces Unpredictable Delays
Garbage collection is a normal part of JVM operation, but its impact becomes more noticeable in distributed systems. Each service manages its own memory and runs its own GC cycles.
Reference: https://openjdk.org/jeps/523
When a service experiences high allocation rates, garbage collection runs more frequently. During certain phases, application threads are paused. If this happens while processing a request, it introduces a delay.
In a distributed flow, this delay affects all dependent services. From the outside, this appears as random latency spikes. From the JVM’s perspective, it is expected behavior.
This disconnect makes performance issues harder to trace and understand.
7. Scaling Requires Understanding Dependencies
Microservices allow individual services to scale independently, but system throughput depends on how these services interact.
If one service scales and increases its capacity, it generates more requests for its dependencies. If those dependencies cannot handle the increased load, they become bottlenecks.
This leads to uneven utilization across the system. Some services operate below capacity, while others are overloaded.
Effective scaling requires understanding the entire request flow and ensuring that dependent services can handle increased traffic. Without this, scaling one part of the system does not improve overall performance.
8. Serialization and Data Transfer Add Overhead
In a monolith, data is passed directly in memory. This is efficient and requires minimal processing.
In microservices, data must be converted into a transferable format before being sent over the network. This involves serialization on the sender side and deserialization on the receiver side.
These operations consume CPU and memory. While each individual conversion is small, repeated conversions across multiple services add measurable overhead.
In high-throughput systems, this overhead becomes a significant part of overall processing time.
9. Caching Becomes Fragmented
Caching in a monolith is centralized, a single cache can serve the entire system, improving performance consistently.
In microservices, each service maintains its own cache. There is no shared memory, which leads to duplication of cached data.
This introduces new challenges. Data updates in one service do not automatically invalidate caches in others. As a result, different services may operate on outdated data.
Managing cache consistency becomes part of system design. Without proper handling, caching can introduce inconsistencies instead of improving performance.
10. From Production Perspective
From a production perspective, performance issues in microservices rarely have a single cause. They emerge from interactions between multiple components.
A slight increase in latency can lead to thread blocking — Thread blocking reduces throughput — Reduced throughput increases queue sizes — Larger queues further increase latency.
At the same time, independent JVM behavior introduces variability across services. One service may experience GC pauses while others continue normally, creating uneven performance.
What makes this challenging is that individual metrics may appear normal. CPU usage may be within limits, and memory may not be exhausted.
Yet the system still feels slow.
This is because performance in distributed systems is determined by how components interact, not just how they perform individually.
Summary
Performance in microservices is fundamentally different from performance in monoliths.
Execution moves from local processing to network-based communication. Latency becomes variable instead of predictable. Runtime behavior becomes distributed instead of centralized.
The system’s performance is defined by the interaction between services, the propagation of latency, and the management of shared resources across independent runtimes.
Scaling improves flexibility, but it does not remove constraints.
Understanding these dynamics is essential for building systems that perform reliably under real-world conditions.
Virtual Threads and the I/O-Bound Service Call Problem
The thread-per-request model is the default in Spring Boot and most Java web frameworks. Each incoming HTTP request is assigned a platform thread, which blocks while waiting for downstream service responses. At high concurrency, the number of blocked threads determines the memory footprint and context-switching cost of the service. With 10ms of CPU work and 50ms of I/O wait per request, the platform thread spends 83% of its time blocked — an expensive way to use OS-level resources.
Virtual threads (Java 21+, Project Loom) address this by making blocking I/O cheap. A virtual thread that blocks on a network call does not park an OS thread — it suspends on the JVM scheduler and releases the carrier thread to other work.
// Java 21+ -- virtual thread executor for I/O-bound service calls
import java.net.URI;
import java.net.http.HttpClient;
import java.net.http.HttpRequest;
import java.net.http.HttpResponse;
import java.time.Duration;
import java.util.concurrent.ExecutorService;
import java.util.concurrent.Executors;
import org.slf4j.Logger;
import org.slf4j.LoggerFactory;

public class CatalogServiceClient {
    private static final Logger log = LoggerFactory.getLogger(CatalogServiceClient.class);

    // newVirtualThreadPerTaskExecutor: each task gets its own virtual thread.
    // Blocking on network I/O unmounts the virtual thread from the carrier thread,
    // freeing it for other tasks. Platform thread count stays bounded regardless
    // of how many concurrent requests are in flight.
    private static final ExecutorService executor =
        Executors.newVirtualThreadPerTaskExecutor();

    private final HttpClient client = HttpClient.newBuilder()
        .connectTimeout(Duration.ofSeconds(2))
        .executor(executor)
        .build();

    public String fetchProductDetails(String productId) throws Exception {
        HttpRequest request = HttpRequest.newBuilder()
            .uri(URI.create("http://catalog-service/products/" + productId))
            .timeout(Duration.ofSeconds(5))
            .GET()
            .build();

        HttpResponse<String> resp = client.send(request, HttpResponse.BodyHandlers.ofString());
        log.info("catalog productId={} status={}", productId, resp.statusCode());
        return resp.body();
    }
}Code language: Java (java)
The behavioural difference is visible under load. A platform thread pool with 200 threads saturates at 200 concurrent blocking calls. A virtual thread executor can handle thousands of concurrent blocking calls with the same number of OS threads, because each block suspends the virtual thread without consuming a carrier thread. The runtime cost of service-to-service I/O decreases proportionally with the number of concurrent requests.
Interview Questions
What issues arise when a high-concurrency microservice handles I/O-bound downstream calls using a fixed platform thread pool at peak traffic?
Root Cause: Platform threads map 1-to-1 to OS threads. Each blocked platform thread holds a kernel thread in WAITING state, consuming memory (typically 512KB–1MB of stack per thread) and adding to the scheduler context-switching load. Internal Behaviour: A pool of 200 platform threads saturates when 200 concurrent requests are each blocked on a downstream HTTP call. The 201st request either queues or is rejected. Because most of the wait is network I/O, the CPU is largely idle — threads are waiting, not computing. Production Impact: The service refuses connections or queues them under load that would be well within CPU capacity. Scaling by adding more instances does not fix the root cause — it multiplies the same bottleneck. Fix: Switch to virtual threads using Executors.newVirtualThreadPerTaskExecutor() in Java 21+, or use a non-blocking HTTP client (Reactor Netty, Vert.x) with a reactive programming model. Both allow a small number of OS threads to handle thousands of concurrent I/O-bound calls.
How does the JVM runtime behaviour differ between a microservice making 1,000 concurrent downstream HTTP calls using platform threads versus virtual threads?
Root Cause: Platform threads carry an OS thread for the entire duration of their existence, including time spent blocked. Virtual threads are JVM-managed and unmount from their carrier thread when blocking, returning the carrier thread to the scheduler for other virtual threads. Internal Behaviour: 1,000 concurrent platform threads require 1,000 OS threads — roughly 500MB–1GB of stack memory and significant scheduler overhead. 1,000 concurrent virtual threads are multiplexed over a small carrier pool (typically one per CPU core). When a virtual thread blocks on network I/O, the JVM suspends it and schedules another virtual thread on the same carrier. Production Impact: A service using virtual threads can handle 10x–100x more concurrent I/O-bound requests with the same JVM heap and CPU configuration. The limiting factor shifts from thread count to downstream service capacity and connection pool limits. Fix: Enable virtual threads in Spring Boot 3.2+ by setting spring.threads.virtual.enabled=true, or create an executor explicitly with Executors.newVirtualThreadPerTaskExecutor() for specific workloads.