Observability — How You Understand a Distributed System in Production
1. Why Debugging Changes Completely in Microservices
One of the biggest mindset shifts in distributed systems happens when something breaks for the first time in production.
Inside a monolith, debugging is usually straightforward. The request enters one application, moves through a predictable execution path, and everything happens inside a single runtime. Logs are centralized, stack traces are local, and failures are easier to follow.
Microservices completely change that experience.
A single request may now travel across multiple services, databases, queues, caches, and external APIs before completing. Every service generates its own logs, runs on its own infrastructure, and processes requests independently.
At that point, understanding the system becomes significantly harder.
The challenge is no longer finding an exception, the challenge is reconstructing the entire story of a request across distributed boundaries.
This is where observability becomes critical.
2. Why Traditional Monitoring Stops Working
Most teams initially approach microservices monitoring the same way they monitored monoliths. They collect CPU metrics, memory usage, request counts, and infrastructure dashboards. These metrics remain useful, but they are no longer sufficient.
Distributed systems fail differently. A service may appear healthy in isolation while still contributing to a system-wide outage. CPU usage may look normal, memory may remain stable, and infrastructure alarms may show no obvious issue.
Yet users continue experiencing failures.
This happens because distributed problems are often behavioral rather than infrastructural. A small latency increase in one dependency may create retries elsewhere. Thread blocking in one service may eventually overload upstream systems.
Traditional monitoring shows the health of individual components, Observability explains how the entire system behaves under pressure.
That distinction becomes extremely important at scale.
3. Logs Alone Can No Longer Explain the System
In monoliths, logs are usually enough to understand failures because execution stays inside one application boundary.
In microservices, logs become fragmented.
A single request may generate logs across ten or twenty different services. Each service writes logs independently, often on different machines, containers, or clusters. Even when every service logs correctly, understanding the full request flow becomes difficult because no single log contains the complete picture.
Engineers now face a new problem. They are not searching for one error message anymore. They are trying to correlate events across distributed systems that execute asynchronously and independently.
Without proper correlation, debugging turns into guesswork.
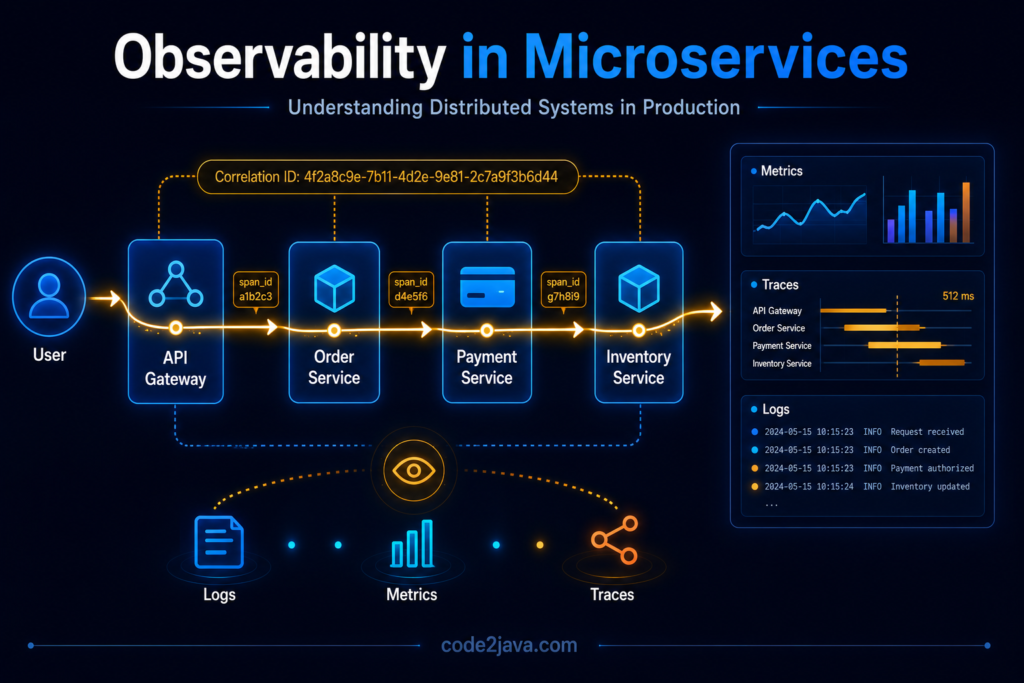
4. The Importance of Correlation IDs
Correlation IDs solve one of the most fundamental observability problems in distributed systems.
When a request enters the system, a unique identifier is attached to it. As the request moves through services, every downstream component carries the same identifier forward. This creates a consistent execution trail.
Instead of searching unrelated logs manually, engineers can track the entire lifecycle of a request across all services using the same correlation ID. This changes debugging dramatically.
Teams no longer investigate isolated service logs individually, they reconstruct the complete request journey from entry point to final response.
In large-scale systems, this becomes one of the most important operational capabilities.
Without correlation IDs, distributed debugging becomes extremely slow and unreliable.
5. Metrics Tell You Something Is Wrong — Not Why
Metrics are essential for understanding overall system health. Request rates, error percentages, queue sizes, memory consumption, and latency distributions help teams identify abnormal behaviour quickly. However, metrics have limitations.
Metrics show symptoms, not execution flow.
For example, an API may suddenly show increased latency. Metrics can confirm that the latency exists, but they cannot explain how the request moved across dependencies or where the delay actually started.
This is why teams often struggle during incidents despite having extensive dashboards. The system clearly indicates something is wrong, but the root cause remains hidden inside request interactions between services.
Metrics are excellent for detection, they are not sufficient for investigation.
6. Distributed Tracing Changes How Systems Are Understood
Distributed tracing solves the visibility gap between services. Instead of treating requests as isolated operations, tracing systems record the complete journey of a request as it moves through distributed components.
Each service contributes timing information, execution details, dependency calls, and failure states into a single trace.
This creates a visual timeline of request execution.
Engineers can now see:
- which service introduced latency
- where retries occurred
- which dependency failed
- how long each operation consumed
Tracing transforms debugging from log searching into behavioural analysis.
Instead of asking “Which server failed?”, teams begin asking “How did this request behave across the system?”
That shift fundamentally changes production troubleshooting.
7. Why Latency Becomes Easier to Understand with Tracing
Latency in distributed systems rarely originates from one obvious source.
A request may spend:
- 20ms inside one service
- 50ms waiting on a database
- 100ms waiting on another service
- additional time inside retries or queues
Without tracing, these delays blend together into one slow response.
Tracing separates the request into individual execution segments. Teams can identify exactly where time is spent and how delays propagate across dependencies.
This becomes extremely valuable during production incidents because latency problems often spread gradually rather than appearing instantly. Tracing reveals those propagation paths clearly.
8. OpenTelemetry and the Standardization of Observability
As distributed systems grew larger, organizations faced another challenge. Every service used different logging formats, monitoring agents, and tracing implementations. Observability became inconsistent across teams and platforms.
This led to the rise of OpenTelemetry – https://opentelemetry.io/
OpenTelemetry provides a standardized approach for collecting telemetry data such as traces, metrics, and logs across distributed systems.
The importance of standardization goes beyond tooling.
In large organizations, observability only works effectively when every service follows consistent instrumentation patterns. Otherwise, traces become incomplete and monitoring data becomes fragmented.
OpenTelemetry helps unify how systems expose operational visibility.
9. Why Alert Fatigue Becomes a Serious Problem
As systems grow, monitoring systems generate enormous numbers of alerts. Initially, teams believe more alerts improve reliability. In practice, excessive alerting creates noise.
During large incidents, hundreds of related alerts may trigger simultaneously across dependent services. Engineers become overwhelmed with symptoms while still lacking clarity about the original root cause.
Over time, teams start ignoring alerts because too many notifications are non-actionable. This creates alert fatigue.
Effective observability is not about generating more alerts, it is about generating meaningful signals that help teams understand system behaviour quickly during production pressure.
The goal is clarity, not volume.
10. Observability Is Ultimately About System Behavior
One of the most important realizations in distributed systems is that observability is not a monitoring feature, it is a way of understanding runtime behaviour.
Microservices systems are dynamic environments where requests continuously move across independent components. Failures spread through dependencies. Latency propagates across services. Retries amplify pressure in unexpected areas.
Without observability, teams lose visibility into how the system actually behaves under real traffic.
At that point, operating the architecture becomes extremely risky because engineers can no longer reason about production behaviour confidently. Observability restores that visibility.
Observability allows teams to understand not just whether systems are healthy, but how the system behaves while under stress.
11. From Production Perspective
From a production perspective, observability becomes more valuable as systems become more distributed.
In smaller systems, engineers can still rely on intuition and manual debugging. At scale, that approach stops working.
Production incidents now involve:
- multiple services
- asynchronous communication
- retries
- queues
- distributed infrastructure
Without tracing and correlation, teams spend most of their time trying to locate the problem instead of solving it. Mature organizations invest heavily in observability because it directly affects recovery speed during incidents.
The faster teams understand system behavior, the faster they stabilize production environments.
Observability is no longer optional infrastructure, it becomes a core operational capability.
Summary
Observability fundamentally changes how distributed systems are operated.
Logs alone are no longer enough because execution spans multiple services. Metrics help detect abnormal behavior, but they cannot explain request flow. Distributed tracing connects the entire execution path and reveals how requests behave across dependencies.
As systems scale, understanding runtime behavior becomes more important than simply monitoring infrastructure health.
Reliable distributed systems require:
- correlated logging
- meaningful metrics
- distributed tracing
- standardized telemetry
- actionable alerting
Without these capabilities, microservices become extremely difficult to operate under production pressure.
Because in distributed systems, the hardest problem is often not fixing the issue.
The hardest problem is understanding what the system is actually doing.