Real Production Failures — What Actually Breaks in Microservices Systems
1. Why Production Failures Never Look Like Architecture Diagrams
Most architecture diagrams make distributed systems look predictable. Services are neatly separated, communication paths are clean, and every component appears isolated and scalable. From a design perspective, the system looks stable and well organized.
Production environments behave very differently.
Real failures rarely begin as dramatic crashes. Most incidents start with something so small that teams initially ignore it. A service becomes slightly slower than usual, a database query starts taking longer under load, Queue sizes increase gradually over time. At first, none of these symptoms appear dangerous.
The problem is that distributed systems amplify small disturbances. What begins as a minor slowdown in one component slowly affects everything connected to it. By the time users notice visible failures, the issue has already spread across multiple services.
This is why microservices failures are difficult to diagnose. The visible outage is usually far away from the original problem.
2. How Latency Quietly Becomes an Outage
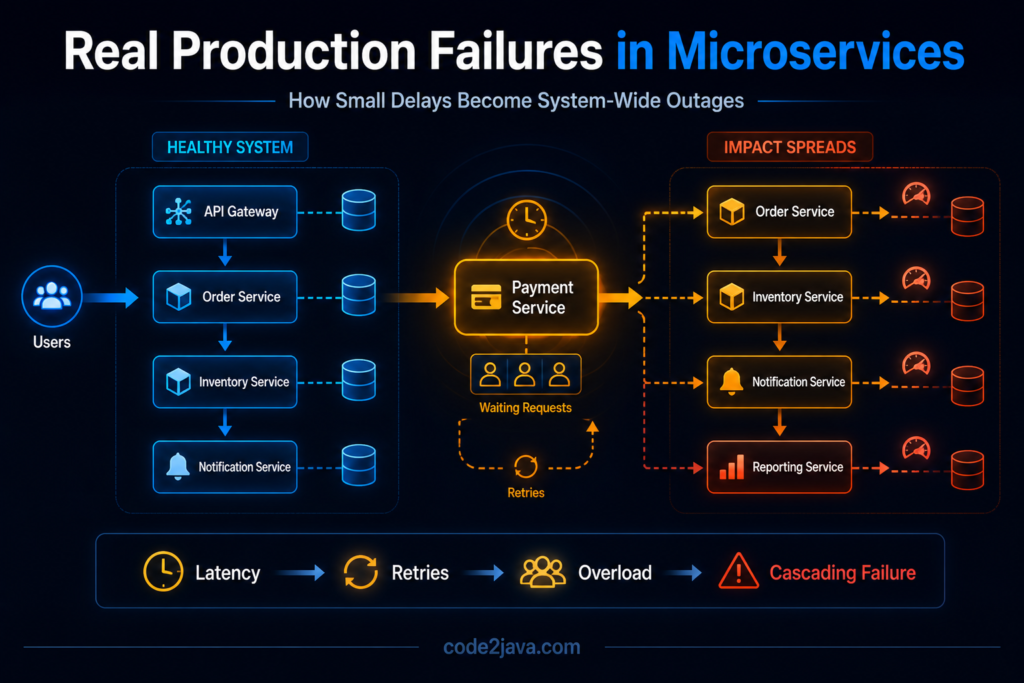
One of the most common causes of production incidents is increasing latency inside a downstream service. A service may slow down because of heavy traffic, inefficient queries, infrastructure pressure, or memory contention. The service itself may still remain operational, but responses now take longer than expected.
Upstream services continue sending requests normally. However, while waiting for responses, their threads remain occupied. As request volume grows, more threads become blocked. Queue sizes increase because incoming requests arrive faster than requests complete.
At this stage, the system has not technically failed, it is simply spending more time waiting. That waiting period is where instability begins.
As latency increases further, timeout thresholds start triggering. Retry mechanisms become active because upstream services assume requests have failed. Those retries create additional traffic, which places even more pressure on the already struggling dependency.
The system enters a feedback loop where latency creates retries, retries create load, and additional load creates even more latency.
Eventually, services that were originally healthy begin failing because they are overwhelmed by the effects of waiting and retry amplification.
3. Why Retry Mechanisms Often Amplify Failures
Retries are usually introduced to improve resilience. Under temporary network failures or short interruptions, retrying requests can help systems recover automatically without affecting users.
The problem appears when retries operate without understanding the health of the downstream service.
When a dependency slows down, multiple upstream services may begin retrying requests simultaneously. Instead of reducing pressure, retries multiply traffic during the worst possible moment.
The overloaded service now spends most of its resources processing duplicate retry requests instead of completing useful work. This creates what engineers commonly describe as a retry storm.
What makes retry storms dangerous is that the original issue may have been relatively small. A short latency increase can quickly evolve into a full-scale outage because the recovery logic unintentionally accelerates system pressure.
In many real incidents, retries contribute more to the outage than the original failure itself.
4. How Cascading Failures Spread Across Services
Distributed systems are highly connected environments. Services depend on other services, which depend on additional services further downstream.
Because of these dependencies, failures rarely remain isolated.
When one dependency becomes slow, upstream services begin accumulating waiting threads. As waiting increases, thread pools approach exhaustion. Once available threads run out, the affected service stops responding to incoming traffic.
This failure immediately impacts upstream systems relying on that service.
Over time, instability spreads outward layer by layer. A problem that originally existed in one service now affects the entire request chain.
This is what makes cascading failures so difficult to control. The architecture itself allows pressure to propagate faster than the system can recover.
From a production perspective, the system does not collapse all at once, it progressively loses the ability to process requests normally.
5. Shared Infrastructure Creates Hidden Coupling
Many teams assume microservices automatically provide isolation because services are deployed independently. Operationally, that isolation is often incomplete.
Services frequently share infrastructure such as databases, Kubernetes clusters, caches, load balancers, or messaging systems. Under heavy traffic, these shared resources become hidden coupling points between otherwise independent services.
For example, one service generating excessive database traffic can degrade performance for unrelated services sharing the same cluster. Similarly, a noisy service consuming excessive CPU or memory inside a shared environment may impact neighboring workloads.
These failures are difficult to trace because the visible symptoms appear in services that are not directly responsible for the issue.
Architecturally, the services may look separated, operationally, they are still connected through shared infrastructure dependencies.
6. Data Consistency Problems Become More Visible During Failures
Distributed failures also expose weaknesses in consistency handling.
Under normal conditions, asynchronous workflows and eventual consistency models appear manageable. During incidents, however, delays and retries increase dramatically, making incomplete workflows far more common.
For an instance, an order may be created successfully while payment processing fails midway. Inventory may remain reserved even though the transaction never completed. Notifications may be delayed while business operations continue processing in the background.
These partially completed states accumulate quickly under production stress.
Without reconciliation mechanisms, the system slowly drifts away from correctness. Teams eventually need background correction jobs to identify missing updates, repair incomplete workflows, and synchronize inconsistent data.
This is one of the biggest differences between monoliths and distributed systems.
Correctness is no longer guaranteed automatically at transaction time, the system must continuously restore consistency over time.
7. Why Monitoring Alone Does Not Solve the Problem
Modern systems generate enormous amounts of monitoring data. Teams collect metrics for CPU, memory, request rates, latency, thread usage, and infrastructure health.
Despite this visibility, distributed outages remain difficult to understand.
The challenge is not lack of data. The challenge is understanding relationships between events occurring across services.
A small latency increase inside one dependency may indirectly create queue buildup somewhere else. Retry traffic may overload unrelated services. Thread exhaustion may appear in upstream APIs even though the root problem exists deeper inside the system.
Individual service metrics often appear healthy in isolation while the overall system continues degrading.
This makes distributed troubleshooting fundamentally different from debugging a monolith. Engineers must understand how pressure moves through the architecture instead of focusing on isolated components.
8. Recovery Is Usually Slower Than the Failure
One of the most misunderstood aspects of distributed outages is recovery behavior.
Teams often assume systems will stabilize immediately after fixing the original issue. In reality, recovery usually takes much longer.
Even after the root cause is resolved, retry traffic may continue flooding services. Queues remain backed up. Databases recover slowly after heavy load. Caches become cold after service restarts, increasing pressure further.
Bringing systems back to stable operation requires controlled recovery.
Teams often restore traffic gradually, reduce retry intensity temporarily, and monitor queue drainage before allowing full production traffic again.
Distributed systems fail progressively, and they recover progressively as well.
9. From Production Perspective
From a production perspective, most large microservices incidents follow similar behavioural patterns.
A small slowdown begins somewhere deep in the system, waiting increases gradually, retry traffic amplifies pressure, dependencies become overloaded, thread pools saturate. Failures spread outward into services that were originally functioning correctly.
The visible outage becomes much larger than the original problem.
What makes these incidents difficult is that symptoms often appear far away from the actual root cause. Teams investigating the outage may initially focus on the wrong service because that service is only experiencing downstream effects.
Stable distributed systems are not systems that completely avoid failure, they are systems designed to contain failure, reduce propagation speed, and recover safely under pressure.
That distinction becomes extremely important as systems scale.
Summary
Real-world microservices failures are rarely isolated technical events. Most outages begin as small performance degradations that slowly propagate through dependencies.
Latency increases lead to waiting threads. Waiting threads trigger retries. Retry storms amplify traffic. Shared infrastructure spreads instability further across services.
The system eventually fails not because one component crashes, but because the architecture allows pressure to move faster than recovery mechanisms can contain it.
Understanding these failure patterns is critical for designing resilient distributed systems.
Because in production environments, reliability is not measured by how systems behave when everything is healthy.
Reliability is measured by how systems behave when conditions begin deteriorating under real-world pressure.
Check out the entire series – Understanding Micro Services
Exponential Backoff with Jitter: The Retry Storm Fix
Retry storms are caused by synchronised retry timing. When many clients fail at the same moment and all retry at the same fixed interval, they send a coordinated burst of requests to a service that is already under pressure. The burst extends the outage by preventing recovery. Jitter — adding randomised delay to the backoff — desynchronises retries and spreads the retry load over time.
// Java 11+ -- exponential backoff with full jitter; prevents coordinated retry storms
import java.util.concurrent.ThreadLocalRandom;
import org.slf4j.Logger;
import org.slf4j.LoggerFactory;

public class RetryPolicy {
    private static final Logger log = LoggerFactory.getLogger(RetryPolicy.class);

    private final int maxAttempts;
    private final long baseDelayMs;
    private final long maxDelayMs;

    public RetryPolicy(int maxAttempts, long baseDelayMs, long maxDelayMs) {
        this.maxAttempts = maxAttempts;
        this.baseDelayMs = baseDelayMs;
        this.maxDelayMs  = maxDelayMs;
    }

    // Full jitter: delay = random(0, min(maxDelay, base * 2^attempt))
    // "Full" jitter is preferred over "equal" jitter for preventing storm synchronisation.
    // See AWS Architecture Blog: "Exponential Backoff And Jitter" for measurement data.
    public long delayForAttempt(int attempt) {
        long exponential = Math.min(maxDelayMs, baseDelayMs * (1L << attempt));
        long jittered = ThreadLocalRandom.current().nextLong(0, exponential + 1);
        log.debug("attempt={} exponentialMs={} jitteredMs={}", attempt, exponential, jittered);
        return jittered;
    }

    public <T> T execute(RetryableOperation<T> operation, String operationName) throws Exception {
        for (int attempt = 0; attempt < maxAttempts; attempt++) {
            try {
                return operation.run();
            } catch (Exception e) {
                if (attempt == maxAttempts - 1) {
                    log.error("operation={} exhausted {} attempts", operationName, maxAttempts, e);
                    throw e;
                }
                long delay = delayForAttempt(attempt);
                log.warn("operation={} attempt={} failed, retrying in {}ms", operationName, attempt, delay);
                // Delay is implemented by the caller or via a scheduled executor.
                // Do not block the calling thread here in production -- use a ScheduledExecutorService.
            }
        }
        throw new IllegalStateException("unreachable");
    }

    @FunctionalInterface
    public interface RetryableOperation<T> {
        T run() throws Exception;
    }
}Code language: Java (java)
The AWS architecture team measured retry storm amplification in detail: fixed-interval retry with 1,000 clients all failing simultaneously produces a request burst that can be 10x the normal traffic. Full jitter reduces this burst to roughly the steady-state rate, because retry times are distributed randomly over the full delay window. Production systems use Resilience4j for this, but understanding the formula matters when tuning the parameters.
Interview Questions
What happens when 500 microservice instances all retry a failed downstream call at the same fixed interval after a brief outage?
Root Cause: Fixed retry intervals synchronise across all instances because they all failed at approximately the same time. When the retry interval elapses, all 500 instances send a request simultaneously. Internal Behaviour: The downstream service, which may have just recovered or be mid-restart, receives 500 requests in a fraction of a second — far above its normal traffic rate. This prevents stable recovery. If the downstream service handles 100 req/sec normally, a 500-request burst at recovery time causes immediate saturation and potential re-failure. Production Impact: Outages extend by minutes beyond the point where the downstream service is technically available. The service recovers, gets hit by the retry burst, fails again, and the cycle repeats. This pattern is called thundering herd. Fix: Replace fixed retry intervals with exponential backoff with full jitter. Each client computes a random delay within an exponentially growing window. The retry load distributes over time instead of arriving as a synchronized burst.
How does the system behave when a cascading failure is caused by a retry storm, and how would you detect this pattern in production logs?
Root Cause: A retry storm looks identical to a legitimate traffic spike in basic metrics. Request rate climbs, error rate climbs, and the downstream service saturates — the same observable signature as a sudden load increase. Distinguishing it requires looking at request origin and timing patterns. Internal Behaviour: During a retry storm, requests arrive in discrete waves, each wave corresponding to a retry interval. The request rate time-series shows periodic spikes separated by the retry delay. If tracing is in place, individual trace IDs appear multiple times — the same logical request being retried. Production Impact: By the time the retry storm is identified, the downstream service has failed multiple times. Each failure wave can trigger retries from more upstream services, amplifying the total load exponentially through the call graph. Fix: In distributed tracing, add an attempt number to span tags. In logging, track retry attempt counts in MDC. Monitor the ratio of total requests to unique trace IDs — a ratio above 1.0 indicates retries are in progress. Alert when this ratio exceeds 1.5 during a degraded state.