1. Production Problem — Latency Spikes Inside a Payment Aggregation Service
A payment aggregation service processing tens of thousands of transactions per second started showing unpredictable latency spikes during peak traffic windows. CPU usage climbed, but thread dumps showed no obvious locks or blocking I/O. Most time accumulated inside HashMap operations.
The service used a HashMap to maintain intermediate aggregation state. The keys came from transaction identifiers derived from a composite object. The hashCode() implementation on that object produced values that clustered within a narrow range.
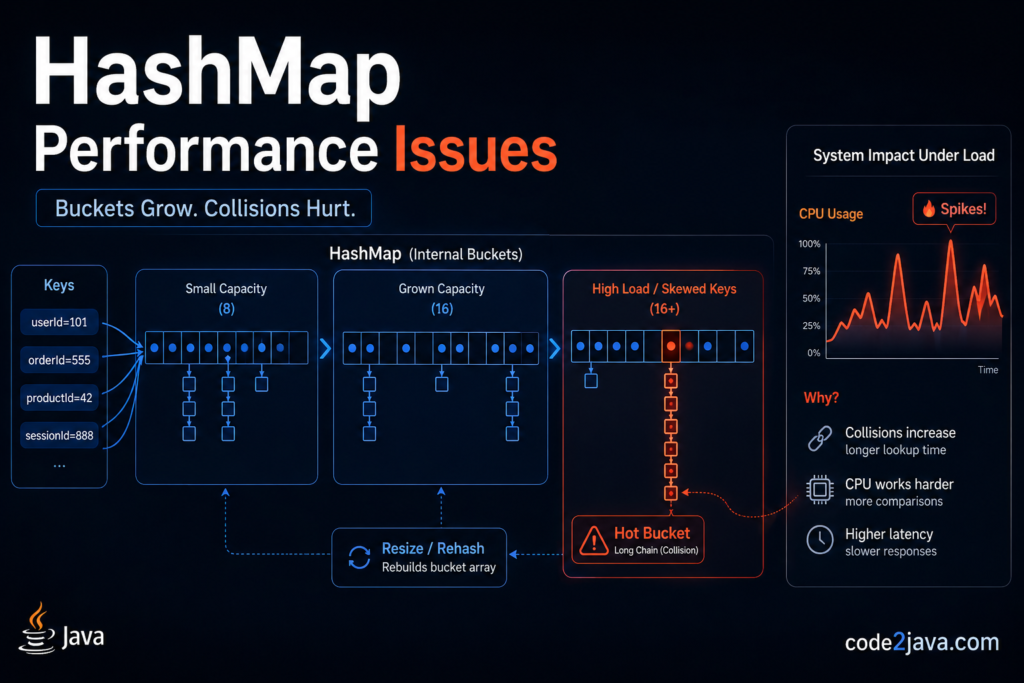
This clustering violated HashMap’s core assumption — that keys distribute uniformly across the hash space. Instead of spreading entries across buckets, many keys landed in the same bucket. What should have been constant-time lookups became traversal-heavy operations.
The symptom appeared as inconsistent response times. Some requests completed in microseconds. Others took orders of magnitude longer. Nobody suspected the HashMap itself, because the API surface gives no indication that performance depends on anything other than the key type.
HashMap’s performance guarantee is probabilistic, not absolute. It degrades silently when data does not match its assumptions.
2. Internal Working — How HashMap Actually Stores and Retrieves Entries
HashMap uses an array of node references as its backing structure. Each array index represents a bucket. The placement of a key into a bucket depends on a hash computation followed by a bitwise index calculation.
The OpenJDK HashMap source reveals the full implementation.
HashMap does not use the hashCode() return value directly. It applies a secondary hash spreading function that XORs the higher bits of the hash into the lower bits. This step exists because the bucket index calculation — (n - 1) & hash, where n is the current array capacity — uses only the lower bits. Without spreading, poorly distributed hashCode() implementations would cause excessive collisions even when capacity is large.
The capacity is always a power of two. This makes the bitwise AND operation equivalent to modulo arithmetic, but faster.
When inserting an entry, if the target bucket is empty, HashMap stores it directly as a single node. If the bucket already contains entries, HashMap chains them. Prior to Java 8, linked lists resolved all collisions. From Java 8 onward, when the number of entries in a single bucket exceeds TREEIFY_THRESHOLD (8) and the overall table capacity reaches at least MIN_TREEIFY_CAPACITY (64), HashMap converts the linked list into a red-black tree. JEP 180: Handle Frequent HashMap Collisions with Balanced Trees introduced this optimization.
The treeification is conditional. Both thresholds must apply simultaneously. A small HashMap with poor key distribution still degrades to linked-list traversal, even on Java 8 and later.
The data structure behind the API changes at runtime depending on key distribution and map size. The same HashMap can behave as an O(1) lookup table or an O(n) linked list, depending entirely on the data it contains.
3. Code Example — Aggregation Pattern That Exposes Distribution Sensitivity
// Java 8+ — demonstrates aggregation under skewed key distribution
import java.util.HashMap;
import java.util.Map;
import org.slf4j.Logger;
import org.slf4j.LoggerFactory;

public class TransactionAggregator {

    private static final Logger log = LoggerFactory.getLogger(TransactionAggregator.class);

    public Map aggregate(int transactionCount, int uniqueKeys) {
        // Initial capacity deliberately undersized to trigger resizing
        Map counters = new HashMap<>(64);

        for (int i = 0; i < transactionCount; i++) {
            String key = "txn-" + (i % uniqueKeys);
            counters.merge(key, 1, Integer::sum);
        }

        log.info("Aggregation complete: {} transactions across {} keys, map size={}",
                transactionCount, uniqueKeys, counters.size());
        return counters;
    }
}
This pattern is common in aggregation pipelines where repeated updates occur for a limited set of keys. The code appears straightforward. The runtime behaviour depends on factors that are invisible at the source level.
When uniqueKeys is small relative to the initial capacity, most buckets remain empty while a few buckets accumulate many entries. This concentrates put and get activity into a small number of chains. Internally, every update to a key that shares a bucket with other keys requires traversal to locate the matching entry before the value can be replaced.
The initial capacity of 64 also means the map will resize multiple times as entries grow. Each resize operation rehashes every existing entry. Under sustained load, these resizes coincide with peak traffic and produce latency spikes that appear random from the caller’s perspective.
4. What Can Go Wrong — Failure Modes Under Production Load
The most common failure mode is collision amplification. When a hashCode() implementation produces clustered values, multiple keys map to the same bucket regardless of map capacity. Internally, the chained structure forces sequential traversal on every lookup. In production, this manifests as inconsistent latency. Some requests return in microseconds, others take milliseconds, and the distribution of response times becomes bimodal without any obvious application-level cause.
The second failure mode is resizing overhead. HashMap doubles its capacity when the entry count exceeds capacity * loadFactor (default 0.75). The resize operation does not work incrementally. It allocates a new array and rehashes every existing entry in a single operation. Under sustained write load, this creates periodic latency spikes. The spikes are proportional to the number of entries — a HashMap with one million entries takes significantly longer to resize than one with ten thousand. If the developer sets the initial capacity too low, resizing occurs repeatedly during the warmup phase of the application.
The third failure mode is memory pressure. Each HashMap entry is a Node object containing the key, value, hash, and a pointer to the next node. For a map with one million entries, this overhead adds up to tens of megabytes of small objects. These objects increase the work the garbage collector must perform during each collection cycle. In latency-sensitive systems, the resulting GC pauses directly affect response times. The JVM garbage collection tuning guide documents how object allocation patterns influence collector behaviour.
HashMap failures in production are rarely about the data structure being wrong. They are about the data not matching the assumptions the data structure was built on.
5. Performance and Scalability — Behaviour Under Load
Under ideal conditions, HashMap provides O(1) average-case performance for get and put operations. This assumes uniform key distribution and sufficient capacity. Neither assumption holds reliably in production.
Skewed key patterns create hotspot buckets. A single bucket with 100 entries requires 50 comparisons on average for a lookup. This is invisible at low traffic. Under thousands of requests per second, the cumulative cost becomes measurable. Thread profiling with tools like async-profiler or JDK Flight Recorder reveals time concentration inside HashMap.getNode() — the internal method that walks the bucket chain.
Resizing behaviour changes with scale. A HashMap that starts at capacity 16 and grows to hold 100,000 entries performs approximately 17 resize operations (each doubling). Each resize rehashes all existing entries. On a system already under load, these operations compete for CPU with request-processing threads. The result is periodic throughput drops that correlate with map growth, not with traffic volume.
GC pressure scales with entry count. Each node allocation adds an object to the young generation. High-throughput maps that insert and remove entries rapidly increase promotion rates and trigger more frequent minor collections. Monitoring GC logs during load tests reveals whether HashMap churn is a significant contributor to pause time.
The gap between HashMap’s theoretical O(1) performance and its actual behaviour under load is where most production issues originate.
6. Trade-offs — What HashMap Gives and What It Costs
HashMap prioritises lookup speed over all other concerns. It achieves this through an array-backed structure with hash-based indexing. The cost appears in three areas.
The first cost is thread safety. HashMap does not synchronize its operations. Concurrent reads and writes from multiple threads can corrupt the internal structure — a resizing operation interleaved with a put can create a cycle in the linked list, causing an infinite loop. This failure does not throw an exception. It silently consumes a CPU core.
The second cost is memory overhead. Each entry allocates a separate object on the heap. For maps holding millions of entries, the per-entry overhead becomes significant relative to the data stored.
The third cost is behavioural unpredictability. Performance depends on key distribution, and the data flowing through the system determines that distribution. The same HashMap configuration performs well with one dataset and poorly with another.
The decision framework is straightforward. HashMap fits when the application controls key generation, when no concurrent access exists or the caller handles synchronization externally, and when the expected entry count is known in advance. When any of these conditions is uncertain, the cost of using HashMap includes the risk of silent degradation.
7. When NOT to Use HashMap
HashMap is the wrong choice when multiple threads modify it concurrently. ConcurrentHashMap provides thread-safe operations with segment-level locking and does not require external synchronization. The performance overhead under moderate contention is small. The cost of a corrupted HashMap under high contention is system failure.
HashMap is also wrong when iteration order matters. It does not guarantee insertion order or any consistent ordering between iterations. LinkedHashMap maintains insertion order. TreeMap maintains sorted order.
HashMap is wrong when key distribution is outside the application’s control. If keys come from external systems, user input, or serialized identifiers, the distribution may cluster in ways that cause collision amplification. In these cases, pre-hashing the key with a stronger function or using a different data structure is more reliable than assuming uniform distribution.
The decision to use HashMap is a bet that the data will behave well. In systems where the data source is unpredictable, that bet is often wrong.
8. Real-World Use Case — Rate Limiting With Per-User Counters
A rate-limiting service used HashMap to track request counts per API consumer. Each incoming request looked up the consumer’s counter, incremented it, and checked whether the limit had been exceeded.
Under moderate load, the system performed well. As traffic scaled, certain consumers generated disproportionately more requests. These high-volume consumers clustered into a small number of buckets due to the structure of their API keys — the keys shared common prefixes, and the resulting hash values collided.
The symptom was uneven latency across rate-limit checks. Most checks completed quickly, but checks for high-volume consumers took significantly longer. Thread profiling showed time accumulation inside bucket traversal methods.
The resolution involved two changes. First, the team set the initial capacity based on the expected number of unique consumers, eliminating resizing during normal operation. Second, they changed the key structure to use a hash of the full API key rather than the raw key value. This spread entries more uniformly across the bucket array and stabilised lookup times across all consumers.
9. Production Interview Questions
Capacity Mismatch Under Burst Traffic
What happens if a HashMap starts with default initial capacity and receives one million entries during a traffic burst?
The root cause is capacity mismatch. HashMap starts at capacity 16 and doubles when the entry count exceeds the load factor threshold. Internally, reaching one million entries requires approximately 17 resize operations. Each resize allocates a new array and rehashes every existing entry. In production, these resizes cause periodic latency spikes that correlate with map growth. The fix is to pre-size the map using new HashMap<>(expectedSize / 0.75 + 1) when the approximate entry count is known.
Hash Collision Hotspots
How does the system behave when keys with identical hashCode values enter a HashMap?
The root cause is hash collision. All keys with the same hash value map to the same bucket. Internally, the bucket stores these entries as a linked list (or a red-black tree if both TREEIFY_THRESHOLD and MIN_TREEIFY_CAPACITY thresholds apply). Every get or put operation on that bucket requires traversal through the chain. In production, this creates a hotspot where operations on colliding keys take linear or logarithmic time instead of constant time. The fix is to ensure that key objects implement hashCode() with strong distribution properties — mixing all significant fields and avoiding trivial implementations like returning a constant.
Concurrent Modification During Resize
What issues arise when two threads concurrently modify a HashMap during a resize operation?
The root cause is structural interference. HashMap’s resize operation does not execute atomically — it iterates through all entries and redistributes them into a new array. Internally, if a second thread performs a put during this redistribution, the internal linked list can form a cycle. In production, this causes a thread to enter an infinite loop inside HashMap.get(), consuming 100% of a CPU core indefinitely. The thread never throws an exception and never returns. The fix is to use ConcurrentHashMap, which handles concurrent modification safely through internal segmentation and CAS operations.
Unbounded Cache Growth
What happens if a large HashMap serves as a long-lived in-memory cache without size limits?
The root cause is unbounded growth. Each HashMap entry creates a Node object on the heap. Internally, as entries accumulate, the heap footprint grows and the garbage collector spends more time scanning and collecting these objects. In production, this increases GC pause frequency and duration. The system gradually becomes less responsive as the cache grows. The fix is to use a bounded cache implementation (such as Caffeine or Guava Cache) that enforces eviction policies, or to use WeakHashMap if entries should become eligible for collection when nothing else references them.
Mutable Key Corruption
How does the system behave when a HashMap holds mutable key objects?
The root cause is hash inconsistency. HashMap stores the hash value at insertion time. Internally, if someone modifies the key object after insertion in a way that changes its hashCode(), subsequent get operations compute a different hash and look in the wrong bucket. In production, entries become unreachable — they exist in the map but no lookup can find them. The map appears to lose data silently. The fix is to use only immutable objects as HashMap keys, or to ensure that no code modifies fields used in hashCode() and equals() after the key enters the map.
10. Summary
HashMap provides fast key-value access when two conditions hold — keys distribute uniformly across the hash space, and the developer sizes the map appropriately for the expected data volume.
When either condition breaks, performance degrades without any explicit signal. Collisions increase traversal cost. Undersized maps trigger expensive resizing. Large maps pressure the garbage collector. Concurrent access corrupts internal structure.
The API presents HashMap as a simple key-value store. The runtime presents it as a data structure whose behaviour depends entirely on the data it contains and the environment it operates in. Understanding that gap is what separates reliable systems from unpredictable ones.
From Real Experience
On a high-traffic payment platform, an in-memory aggregation service started exhibiting latency spikes that appeared at irregular intervals. The service was stateless except for a single HashMap that accumulated transaction counts during each processing window.
Initial investigation focused on network latency and database connection pooling. Both were healthy. Thread dumps showed no contention. GC logs showed minor collections within acceptable ranges. The problem only surfaced under sustained peak traffic and disappeared during off-peak hours.
The diagnostic step that changed the investigation was profiling with async-profiler during a traffic peak. The flame graph showed a concentration of time inside java.util.HashMap.getNode. The bucket distribution was severely skewed — three buckets held over 60% of all entries.
The transaction identifiers used as keys concatenated a fixed merchant prefix with a sequence number. The fixed prefix dominated the hash computation. The spreading function inside HashMap could not compensate for the low entropy in the input.
The resolution involved two changes. The team modified the key construction to hash the full identifier with Objects.hash() before using it as a map key. They set the initial capacity based on the expected number of unique merchants per processing window. Both changes together eliminated the skew and removed the resizing overhead.
The broader lesson: HashMap performance is not a property of the data structure. It is a property of the relationship between the data structure and the data. When no one examines that relationship, the failure mode is silence — the system slows down without telling anyone why.