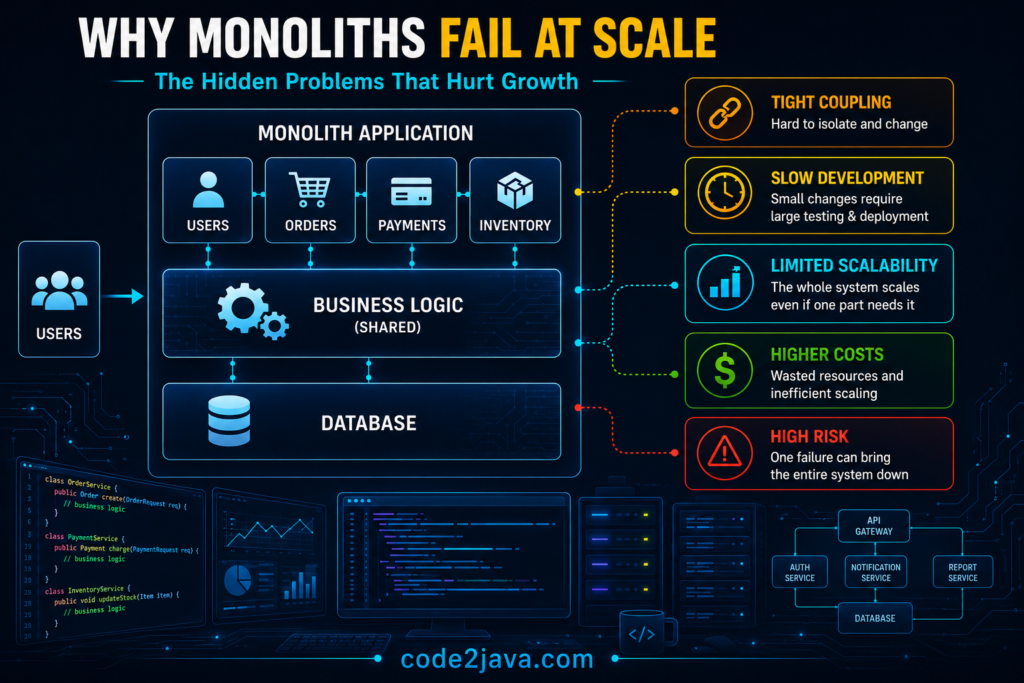
The Breaking Point — Why Monoliths Fail at Scale
1. Architectural Context
A monolith works well in the beginning because everything runs in one place – one application, one database, one transaction boundary.
When a request comes in, it is processed completely inside a single JVM. If anything fails, everything rolls back. This gives strong consistency and predictable behaviour. At this stage, the system is simple, fast, and easy to debug.
The hidden assumption is that all parts of the system can continue sharing the same runtime as load increases. This assumption does not hold at scale.
2. Shared Runtime Becomes a Problem
As the system grows, it starts doing more work at the same time. User requests run alongside background jobs like reporting, syncing, or batch processing. All of these use the same CPU, memory, and threads. The JVM does not prioritize business logic. It treats all workloads equally.
As background work increases, memory usage grows and garbage collection runs more often. When GC runs, it pauses all threads. This causes random delays in user requests. The system still works, but response time becomes inconsistent.
3. Scaling Resources Does Not Fix It
Adding more CPU or memory helps temporarily, but the problem comes back. The issue is not lack of resources. It is that everything is sharing the same resources. More memory reduces how often GC runs, but increases how long it pauses. More CPU adds capacity, but threads still compete.
The system becomes harder to predict as load increases.
4. Database Becomes a Bottleneck
All operations in a monolith go through the same database. At high traffic, multiple requests try to update the same data. The database locks rows to maintain consistency.
Reference: https://docs.oracle.com/en/database/oracle/oracle-database/19/cncpt/transactions.html
As locks increase:
- Transactions wait
- Execution slows down
- Throughput drops
The system becomes slow not because it cannot process requests, but because requests are waiting.
5. Thread Blocking Limits Throughput
Each request uses one thread from start to finish.
When the database is slow or locked, threads wait. While waiting, they still occupy system resources.
As more threads wait:
- Thread pools fill up
- New requests get delayed
- Latency increases
Eventually, the system cannot accept new requests quickly, even if CPU is available.
6. Deployment Becomes Risky
In a monolith, everything is deployed together. Even a small change requires restarting the entire application.
When the system restarts:
- Caches are cleared
- Connections reset
- Load on the database increases temporarily
This causes short-term instability.
The bigger issue is that every change affects the whole system. This increases risk and slows down releases.
7. Team Scaling Becomes Difficult
As more teams work on the system, they all share the same codebase and release cycle. Changes need coordination. Testing becomes complex because everything is connected. Over time, development slows down because the system is tightly coupled.
8. The Real Breaking Point
At this stage, the system has been optimized in many ways:
- JVM tuning
- Database tuning
- Infrastructure scaling
But problems still remain:
- Latency is inconsistent
- Throughput does not scale well
- Deployments are risky
The root issue is not performance tuning. It is that everything is tightly connected:
- Same runtime
- Same database
- Same deployment
This coupling limits how far the system can scale.
9. From Production Perspective
Assume in high-traffic system, one can improve performance multiple times through tuning. Each change may help slightly, but problems return back under load.
One can analyse threads behaviour, GC logs, and database locks, and most of the times the clear picture that comes out is: The system was not inefficient. It was constrained by design. All parts were sharing the same resources, and that became the limit.
10. Summary
A monolith works well when the system is small and controlled.
At scale, it starts facing issues because everything is shared:
- Runtime resources create contention
- Database becomes a bottleneck
- Threads get blocked
- Deployments affect the entire system
These problems make the system unpredictable under load. That unpredictability is the real breaking point.
How the JVM Exposes Thread Pool Saturation
The visible symptom of a monolith failing at scale is latency, not errors. The JVM thread pool fills up as background jobs compete with request-handling threads, and the application keeps running. Queue depth is the earliest observable signal — it rises before users notice anything wrong.
The following shows how to instrument a shared ThreadPoolExecutor to observe saturation in production. Pool state — active threads, queue depth, completed count — is the diagnostic layer the JVM exposes when the shared runtime assumption starts breaking down.
// Java 11+ -- monitoring thread pool saturation in a shared-runtime monolith
import java.util.concurrent.ThreadPoolExecutor;
import org.slf4j.Logger;
import org.slf4j.LoggerFactory;

public class MonolithHealthMonitor {
    private static final Logger log = LoggerFactory.getLogger(MonolithHealthMonitor.class);

    // Schedule on a 30-second interval.
    // Queue depth rising while active == max is the earliest signal
    // that background jobs are starving request threads.
    public static void logPoolState(ThreadPoolExecutor executor, String poolName) {
        int active = executor.getActiveCount();
        int queued = executor.getQueue().size();
        int max    = executor.getMaximumPoolSize();
        long done  = executor.getCompletedTaskCount();

        log.info("pool={} active={}/{} queued={} completed={}",
            poolName, active, max, queued, done);

        if (active == max && queued > 0) {
            // All threads occupied and tasks accumulating.
            // This is the JVM-level signal that background jobs are blocking request threads.
            log.warn("pool={} saturated -- {} tasks queued. Response times will degrade.",
                poolName, queued);
        }
    }
}Code language: Java (java)
In a monolith, a single pool handles everything. Once threads block on a slow database or external call, queued tasks accumulate. With CallerRunsPolicy, the Tomcat acceptor thread itself blocks — no exception is thrown, but the server stops accepting new connections. Latency climbs while logs stay clean.
Interview Questions
What happens when all threads in a monolith shared thread pool are occupied by background batch jobs and new HTTP requests arrive?
Root Cause: The JVM thread pool treats all submitted tasks equally — there is no built-in prioritisation for user-facing requests. Internal Behaviour: Incoming HTTP requests are added to the blocking queue. If the queue is bounded and full, the rejection handler fires. With CallerRunsPolicy, the Tomcat acceptor thread blocks, preventing new connections from being accepted. Production Impact: The application becomes unresponsive without any exceptions in the logs. A thread dump shows all pool threads in WAITING state on a database or downstream call, not RUNNABLE on business logic. Fix: Separate executor services for background jobs and request handling. Background batch processing belongs in a queue-driven worker process, not the same JVM serving live API traffic.
How does JVM garbage collection behaviour change as a monolith heap approaches old generation capacity under sustained traffic?
Root Cause: All components share the same heap. When traffic grows, allocation rates from HTTP layers, ORM sessions, caches, and background jobs compound in the same old generation simultaneously. Internal Behaviour: G1 GC triggers concurrent marking cycles more frequently. When marking cannot keep pace with allocation, G1 falls back to a full stop-the-world collection. On heaps of 8 GB or more, this pause exceeds 500ms. Production Impact: Latency spikes appear across all endpoints at the same time with no correlation to any specific feature. The GC log shows an evacuation failure. Fix: Enable GC logging with -Xlog:gc*:file=gc.log and analyse with GCEasy or Java Flight Recorder. In a monolith, the fix is heap tuning or isolating high-allocation workloads — both approaches have limits that a service-per-JVM architecture avoids entirely.
The Database as the Shared Bottleneck
Thread pool saturation is one failure mode of a shared runtime. The database connection pool is the other. In a monolith, every component — user-facing APIs, background jobs, reporting queries, admin tools — draws from the same database connection pool. A reporting query that holds a connection for 10 seconds while scanning a large result set is not available to serve a user request during that time. At scale, this contention becomes the primary latency source even when the thread pool is healthy.
HikariCP, the default connection pool in Spring Boot, exposes pool state through JMX and metrics. Monitoring the pending acquisition count — the number of threads waiting to acquire a connection — gives the same early warning that queue depth gives for the thread pool. The warning appears before timeouts and before errors reach the user.
// Java 11+ -- HikariCP connection pool monitoring for shared-pool contention detection
import com.zaxxer.hikari.HikariDataSource;
import com.zaxxer.hikari.HikariPoolMXBean;
import org.slf4j.Logger;
import org.slf4j.LoggerFactory;

public class ConnectionPoolMonitor {
    private static final Logger log = LoggerFactory.getLogger(ConnectionPoolMonitor.class);

    // Schedule on a 15-second interval alongside the thread pool monitor.
    // pendingAcquires > 0 means threads are waiting for a connection -- pool is saturated.
    public static void logPoolState(HikariDataSource dataSource) {
        HikariPoolMXBean pool = dataSource.getHikariPoolMXBean();
        if (pool == null) {
            log.warn("HikariCP pool MXBean not available -- metrics disabled");
            return;
        }

        int active  = pool.getActiveConnections();
        int idle    = pool.getIdleConnections();
        int pending = pool.getThreadsAwaitingConnection();
        int total   = pool.getTotalConnections();

        log.info("db-pool active={} idle={} total={} pending={}",
            active, idle, total, pending);

        if (pending > 0) {
            // Threads are waiting for a connection. This is direct evidence of pool exhaustion.
            // In a monolith, the usual cause is long-running reporting or batch queries
            // holding connections while user-facing requests queue behind them.
            log.warn("db-pool {} threads waiting for connection -- pool exhausted. Check for long-running queries.",
                pending);
        }

        if (active == total && idle == 0) {
            log.error("db-pool fully occupied: active={} idle=0 -- connection acquisition will fail or queue", active);
        }
    }
}Code language: Java (java)
The combination of thread pool saturation and connection pool saturation is how a monolith typically fails in practice. A slow reporting query holds database connections. User-facing requests acquire connections quickly but then block waiting for the thread pool, which is occupied by background tasks that are themselves waiting for database connections from the same pool. The system deadlocks on shared resources without any single component appearing to be at fault.
Why the Bottleneck Cannot Be Solved by Scaling the Monolith
The instinct when a monolith runs out of capacity is to scale horizontally — add more instances. This works for stateless compute-bound workloads. It does not work when the bottleneck is the shared database. Adding a second monolith instance doubles the number of connections hitting the database. The database, which was already the bottleneck, now receives twice the connection pressure. Connection pool limits apply per instance, but the database has a global connection limit. At a certain scale, the database rejects new connections entirely.
Scaling the database vertically — larger instance, more CPU, more memory — delays the problem but does not resolve it. The fundamental issue is that every component in the monolith competes for the same database, regardless of how large that database is. A single poorly-written admin query can degrade the entire user-facing system because it runs against the same database that user requests depend on. There is no isolation boundary between workloads.
Microservices address this by assigning each service its own database. A reporting service that runs expensive queries against a read replica does not affect the connection pool of the order service. A background job that writes to a separate data store does not compete with user-facing reads. Workload isolation at the data layer is what makes independent scaling possible — and it is the property a monolith cannot provide without significant re-architecture.